


Walmart: Consistent Upward Revenue Trajectory
Walmart (WMT +1.21%) operates as a global retail powerhouse that sells groceries, daily consumables, and general merchandise through thousands of physical stores and expanding e-commerce platforms.
It agreed to acquire the connected TV advertising platform Vibe.co in June 2026 and opened a third owned milk processing facility, while it reported about 3% net income margin for the quarter ended April 30, 2026.
Target: Seasonal Revenue Volatility
Target (TGT +3.89%) operates as a general merchandise retailer providing food, apparel, and home decor to consumers across the United States through its store network and digital channels.
It announced a multi-season merchandise partnership with Hollister and appointed a new chief global supply chain officer in mid-2026, while it posted approximately 3% net income margin for the quarter ended May 2, 2026.
Why Revenue Matters for Retail Investors
Revenue here refers to the data provider’s standardized income-statement revenue line item, and it serves as a critical indicator of a company’s ability to attract consistent customer spending over time.
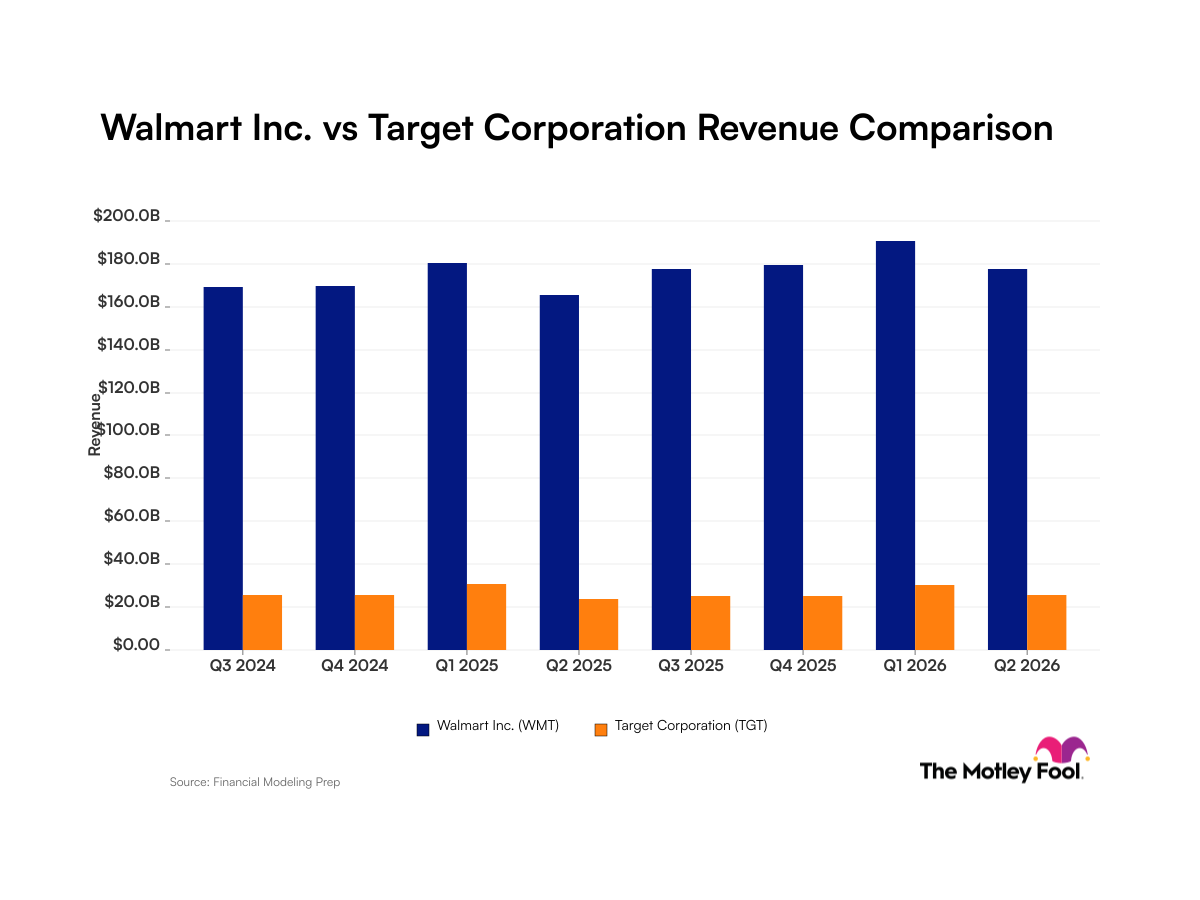
Quarterly Revenue for Walmart and Target
| Quarter (Period End) | Walmart Revenue | Target Revenue |
|---|---|---|
| Q3 2024 | $169.3 billion (period ended July 2024) | $25.5 billion (period ended Aug. 2024) |
| Q4 2024 | $169.6 billion (period ended Oct. 2024) | $25.7 billion (period ended Nov. 2024) |
| Q1 2025 | $180.6 billion (period ended Jan. 2025) | $30.9 billion (period ended Feb. 2025) |
| Q2 2025 | $165.6 billion (period ended April 2025) | $23.8 billion (period ended May 2025) |
| Q3 2025 | $177.4 billion (period ended July 2025) | $25.2 billion (period ended Aug. 2025) |
| Q4 2025 | $179.5 billion (period ended Oct. 2025) | $25.3 billion (period ended Nov. 2025) |
| Q1 2026 (Jan. 2026) | $190.7 billion | $30.5 billion |
| Q2 2026 | $177.8 billion (period ended April 2026) | $25.4 billion (period ended May 2026) |
Data source: Company filings.
Data source: Company filings. Data as of July 7, 2026.

