


courtneyk/E+ via Getty Images
The top line of Orrstown Financial Services, Inc. (NASDAQ:ORRF) will benefit from high-single-digit loan growth and margin expansion. However, the net interest income growth will likely be unable to compensate for provision normalization and higher operating costs. As a result, I’m expecting earnings to decline by 21% year-over-year to $2.33 per share in 2022. The year-end target price suggests a high upside from the current market price. Additionally, Orrstown Financial is offering a decent dividend yield. Based on the total expected return, I’m adopting a buy rating on Orrstown Financial Services.
Total Loan Portfolio to Fare Better than Last Year
After several years of remarkable loan growth, the loan portfolio remained somewhat flattish last year partly because of the Paycheck Protection Program (“PPP”) forgiveness. The PPP loan balance declined from around $460 million at the end of December 2020 to $195.3 million at the end of December 2021. As there is still a sizable PPP loan balance outstanding, the portfolio will likely continue to face pressure this year. PPP loans outstanding made up around 9.9% of total loans at the end of December 2021.
Further, the extensive branch consolidations conducted in the last few years are likely to curb loan growth. According to details given in the 10-K filing, Orrstown Financial consolidated six branches, discontinued three loan production offices, and reduced back-office real estate during 2021. The subsidiary bank of Orrstown Financial closed 30% of its branches between the fourth quarter of 2019 and the third quarter of 2021, while Orrstown Financial reduced its real estate by 27% during the same period, as mentioned in the December presentation. The advent of online banking will blunt the impact of branch consolidations. Nevertheless, I believe the overall effect of the sharp reduction in physical contact with customers will be negative for loan growth in the short term.
On the other hand, economic recovery will likely drive loan growth this year. Orrstown Financial operates in Pennsylvania and Maryland, both of which experienced remarkable GDP growth during the third quarter of 2022, according to official sources. Further, both states reported unemployment rates of 5.4% in January 2022, which is much higher than the national average but still better than the last two years.
The loan portfolio has grown by strong double-digit rates in the past, partly because of merger and acquisition activity in 2018 and 2019. Considering the factors given above, I’m expecting loan growth for 2022 to be better than 2021 but below the historical average. I’m expecting high-single-digit loan growth in 2022. Further, I’m expecting other balance sheet items to grow in line with loans. These estimates exclude any potential M&A activity this year as there have been no such announcements so far. The following table shows my balance sheet estimates.
| FY17 | FY18 | FY19 | FY20 | FY21 | FY22E | ||
| Financial Position | |||||||
| Net Loans | 997 | 1,234 | 1,630 | 1,960 | 1,959 | 2,120 | |
| Growth of Net Loans | 14.5% | 23.7% | 32.1% | 20.2% | (0.0)% | 8.2% | |
| Other Earning Assets | 429 | 532 | 530 | 577 | 669 | 724 | |
| Deposits | 1,220 | 1,559 | 1,876 | 2,357 | 2,465 | 2,668 | |
| Borrowings and Sub-Debt | 177 | 179 | 250 | 109 | 57 | 62 | |
| Common equity | 145 | 173 | 223 | 246 | 272 | 289 | |
| Book Value Per Share ($) | 17.6 | 20.3 | 21.2 | 22.3 | 24.5 | 26.0 | |
| Tangible BVPS ($) | 17.6 | 18.4 | 18.7 | 20.1 | 22.4 | 24.0 | |
|
Source: SEC Filings, Author’s Estimates (In USD million unless otherwise specified) |
|||||||
Margin Appears Moderately Sensitive to Rate Changes
Orrstown Financial has increased its interest-rate sensitivity by shifting its liability and asset mixes during 2021. This improvement is visible in the management’s interest-rate sensitivity analysis results given in the 10-K filing and copied below.
2021 10-K Filing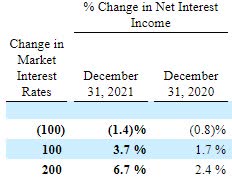
The net interest income is now moderately sensitive to rate changes. The Federal Reserve projects a 175-basis points increase in federal funds rate this year. Based on the interest rate projections and the rate sensitivity, I’m expecting the margin to increase by four basis points in the second half of 2022.
Normal Net Provisions Expense Likely for 2022
The net provision expense of Orrstown Financial remained subdued last year because of a large provision reversal in the first quarter of 2021. Allowances made up 1.07% of total loans, while non-performing loans made up 0.33% of total loans at the end of December 2021, as mentioned in the 10-K filing. The company has maintained a higher allowance-to-total-loan ratio in the past. Therefore, I don’t think further significant reserve releases are on the cards.
Further, I’m expecting a higher provision expense because of greater loan additions this year relative to last year. Overall, I’m expecting the provision expense, net of reversals, to make up around 0.11% of total loans in 2022. This is the same as the average provision-expense-to-total-loan ratio for the last five years.
Expecting Earnings to Decline by 21% Year-Over-Year
I’m expecting earnings to decline this year as net interest income growth will be unlikely to compensate for provision normalization. Further, the operating expenses are likely to increase despite the branch consolidations. This increase in operating expenses will be attributable to balance sheet growth as well as inflation, which will boost total salary expenses. Moreover, the non-interest income will likely decline as higher interest rates will hurt mortgage refinancing and purchasing activity. Overall, I am expecting Orrstown Financial to report earnings of $2.33 per share in 2022, down 21% year-over-year. The following table shows my income statement estimates.
| FY17 | FY18 | FY19 | FY20 | FY21 | FY22E | ||
| Income Statement | |||||||
| Net interest income | 44 | 52 | 69 | 84 | 87 | 90 | |
| Provision for loan losses | 1 | 1 | 1 | 5 | 1 | 2 | |
| Non-interest income | 20 | 21 | 29 | 28 | 29 | 28 | |
| Non-interest expense | 50 | 58 | 77 | 74 | 74 | 83 | |
| Net income – Common Sh. | 8 | 13 | 17 | 26 | 33 | 26 | |
| EPS – Diluted ($) | 0.98 | 1.50 | 1.61 | 2.40 | 2.96 | 2.33 | |
|
Source: SEC Filings, Earnings Releases, Author’s Estimates (In USD million unless otherwise specified) |
|||||||
Actual earnings may differ materially from estimates because of the risks and uncertainties related to the COVID-19 pandemic and the timing and magnitude of interest rate hikes.
Target Price Signals a Good Capital Appreciation Opportunity
Orrstown Financial is offering a dividend yield of 3.2% at the current quarterly dividend rate of $0.19 per share. The earnings and dividend estimates suggest a payout ratio of 33% for 2022, which is in line with the five-year average of 34%. Therefore, I’m not expecting any change in the dividend level.
I’m using the historical price-to-tangible book (“P/TB”) and price-to-earnings (“P/E”) multiples to value Orrstown Financial. The stock has traded at an average P/TB ratio of 1.11 in the past, as shown below.
| FY17 | FY18 | FY19 | FY20 | FY21 | Average | |
| T. Book Value per Share ($) | 17.6 | 18.4 | 18.7 | 20.1 | 22.4 | |
| Average Market Price ($) | 23.3 | 24.4 | 21.0 | 15.4 | 22.9 | |
| Historical P/TB | 1.32x | 1.33x | 1.13x | 0.77x | 1.02x | 1.11x |
| Source: Company Financials, Yahoo Finance, Author’s Estimates | ||||||
Multiplying the average P/TB multiple with the forecast tangible book value per share of $24.0 gives a target price of $26.7 for the end of 2022. This price target implies a 12.7% upside from the March 18 closing price. The following table shows the sensitivity of the target price to the P/TB ratio.
| P/TB Multiple | 0.91x | 1.01x | 1.11x | 1.21x | 1.31x |
| TBVPS – Dec 2022 ($) | 24.0 | 24.0 | 24.0 | 24.0 | 24.0 |
| Target Price ($) | 21.9 | 24.3 | 26.7 | 29.1 | 31.5 |
| Market Price ($) | 23.7 | 23.7 | 23.7 | 23.7 | 23.7 |
| Upside/(Downside) | (7.6)% | 2.5% | 12.7% | 22.8% | 32.9% |
| Source: Author’s Estimates |
The stock has traded at an average P/E ratio of around 13.4x in the past, as shown below.
| FY17 | FY18 | FY19 | FY20 | FY21 | Average | |
| Earnings per Share ($) | 0.98 | 1.50 | 1.61 | 2.40 | 2.96 | |
| Average Market Price ($) | 23.3 | 24.4 | 21.0 | 15.4 | 22.9 | |
| Historical P/E | 23.7x | 16.2x | 13.1x | 6.4x | 7.7x | 13.4x |
| Source: Company Financials, Yahoo Finance, Author’s Estimates | ||||||
Multiplying the average P/E multiple with the forecast earnings per share of $2.33 gives a target price of $31.3 for the end of 2022. This price target implies a 32.4% upside from the March 18 closing price. The following table shows the sensitivity of the target price to the P/E ratio.
| P/E Multiple | 11.4x | 12.4x | 13.4x | 14.4x | 15.4x |
| EPS 2022 ($) | 2.33 | 2.33 | 2.33 | 2.33 | 2.33 |
| Target Price ($) | 26.7 | 29.0 | 31.3 | 33.7 | 36.0 |
| Market Price ($) | 23.7 | 23.7 | 23.7 | 23.7 | 23.7 |
| Upside/(Downside) | 12.7% | 22.5% | 32.4% | 42.3% | 52.1% |
| Source: Author’s Estimates |
Equally weighting the target prices from the two valuation methods gives a combined target price of $29.0, which implies a 22.5% upside from the current market price. Adding the forward dividend yield gives a total expected return of 25.7%.
The market appears to have overreacted to the prospects of an earnings decline. In my opinion, the current market price’s high discount to the target price is unjustifiable. Based on the total expected return, I’m adopting a buy rating on Orrstown Financial Services.

