


OMAHA — Fueled by discontent over schools’ handling of COVID-19, sex education, curriculum and other issues, new political groups have sprung up this election cycle, endorsing local school board candidates and not pulling any punches on where they stand on the issues.
The endorsements may give voters greater insight into the candidates, whose values and beliefs could be hard to pin down in years past. Groups are contacting candidates, screening them and posting endorsements on social media.
Fired coach discusses teachers’ plight after Grand Island superintendent’s letter
Nebraska Board of Education candidate asks for privacy after allegations against son made public
It will still take some work, however, for voters to sift through the endorsements, separate fact from fiction and figure out whose oval to color on the ballot.
Among the new groups active this year are Protect Nebraska Children Political Action Committee, Nebraskans for Educational Excellence, Nebraskans Against Government Overreach and Women Who Run Nebraska.
Jason Holling-Karas, a Bennington school board candidate, said he’s received about five questionnaires from various groups and political action committees seeking candidates to endorse.
People are also reading…
“There have been a whole bunch of them coming from different organizations, and some of them are kind of extreme. It’s really been all over the board,” he said.
Holling-Karas said the questions focused on a wide range of topics, from candidate opinions on the pandemic to parental control to racism. He said he chose to answer surveys from organizations that had values he aligned with and disregarded others that seemed to stray from the school board race.
“There were some others that I don’t think any good would come out of answering them either way,” he said. “Why do you need to know stances on abortion for a school board position? It’s supposed to be a nonpartisan position. It’s been a very interesting experience going through all of them.”
Holling-Karas has been endorsed by Nebraskans for Educational Excellence, a group formed by Millard Public Schools parents last fall.
From the classroom: ‘Freedom Writers Diary’ faces backlash in Crete; younger Joel coming home
‘Feels like forward motion’ — Ambitious equity road map gives insight into LPS’ future
The group has endorsed candidates in the Omaha, Millard, Papillion-La Vista, Bennington, Bellevue, Gretna and Elkhorn districts, as well as elsewhere in the state.
Holling-Karas said when he filled out the form for an endorsement, the group asked if he agreed on values such as “public education for all” or using local health experts to make decisions concerning face mask policies.
“They were much more inclusive and much more community-focused — things that more resonated where I am at,” he said. “I’m glad I got endorsed by them, because they accurately reflect my views.”
According to its organizers, Nebraskans for Educational Excellence started as a grassroots group of Millard parents concerned about the district’s response to the pandemic.
Members were concerned about a lack of mask mandates in many public school districts, against the advice of local public health leaders, while COVID-19 numbers were still high and children under age 12 had no access to vaccines. Several members have or know children who are immunocompromised, said Allison Kinney-Walker, one of the group’s core members.
Additionally, the group was concerned about legislative bills members believed would restrict important conversations about race and gender in schools and redirect money for public schools to private schools.
The group has a written platform, which includes support for teaching students about “reproductive health, sexual orientation, gender identity and social-emotional well-being.”
“We support the development of health standards that would include these topics, while acknowledging that each district can adopt the standards that they feel are appropriate for their district,” Kinney-Walker said.
The platform also calls for teaching “an accurate depiction of American history, which includes the experiences and contributions of all Americans.”
The group says that critical race theory is not being taught in public schools and “the politicization of American history is having a chilling effect on teaching and on our teachers.”
Women Who Run Nebraska endorses progressive women running for office. Co-founder Denise Blaya Powell said while the organization was formed in 2017 solely to support women, it became a political action committee in 2019 after staff realized what candidates needed most was funding.
“We want to generate enthusiasm and support women up and down the ballot, to help candidates spread their message far and wide,” Powell said.
Women Who Run Nebraska is officially nonpartisan — though Powell said while it has historically endorsed Democrats and nonpartisan candidates, “there are a lot of Republicans in this cycle we are excited about.”
The four-person staff has endorsed 67 candidates across the state so far, including some running for school boards in Bellevue, Elkhorn, Gretna, Millard, Omaha, Papillion-La Vista, Ralston and the Westside district.
Powell said she has also seen the trend over the past few years that more political groups are popping up to support candidates. While midterm elections are usually quieter, Powell said she believes more people are involved in this year’s midterm elections than in recent years.
“I think it’s moved a lot more people to want to act and step up, whether that means showing up at a school board meeting or testifying at the Legislature or running for office themselves,” Powell said. “It’s a really big, important year. People are looking at decisions being made at school boards across the state, or big debates in the Legislature, and are sparking a lot of important conversations.”
Nebraskans Against Government Overreach, which was formed in 2020, has endorsed almost 60 candidates across the state, including school board candidates in the Bellevue, Millard and Elkhorn districts.
Founder Allie French said the group technically launched in 2018 but focused on fighting against mandated vaccinations. After COVID-19 hit, it transitioned to supporting conservative candidates running for local office. The group has also spoken out against the state health education standards and face mask policies. It’s also promoted a group that claims the 2020 election in Nebraska was fraudulent.
French said she hopes the organization provides voters “simple guidance” to selecting the right candidates.
“We look for individuals who stand up for medical freedom and are trying to lessen the government’s interference on people’s daily lives,” she said. “Sometimes that’s taxes, other cases it’s school choice or ensuring a patriotic curriculum is being delivered.”
The Protect Nebraska Children Political Action Committee has endorsed nearly 50 candidates statewide.
The group was formed by opponents of statewide health education standards that, as initially proposed, would have taught elementary school students about gender identity and sexual orientation.
The group supports conservative candidates and has a Facebook group that contains a membership of more than 22,000 people.
Sue Greenwald, one of its leaders, said the endorsements are meant as a service to voters.
“Nebraska is a conservative state and they want to vote for conservatives, they just don’t know who they are,” she said.
As of Friday, the group had endorsed candidates in Bellevue, Papillion-La Vista, Omaha and Elkhorn public schools.
Brian Parizek, a lieutenant with the Douglas County Sheriff’s Office, found out he was endorsed by Protect Nebraska Children last week. He’s running for the Omaha Public Schools board in Subdistrict 6.
Parizek said Protect Nebraska Children’s endorsement questionnaire was just one of a few he’s filled out and he was happy to learn he had received its endorsement.
“They certainly have children’s education and growth at heart,” Parizek said. “I know some people might describe the organization in a different way, but what they really want is the best education for their students.”
Meantime, Loan Eby, who is running for the Papillion-La Vista school board, said she rejects all endorsements and offers of financial support.
Eby said she doesn’t want to be beholden to any group or risk being accused of running afoul of accountability laws.
“I’ve been asked by multiple groups, and I’m not going to say which ones, if I wanted to be endorsed by that group,” she said. “And every time I have respectfully declined.”
She said she doesn’t fit into the usual political camps.
“I’m not blue. I’m not red. And, actually, I am not political.”
Breaking down Lincoln’s public schools: Enrollment, test scores and more
Adams

Adams Elementary: 7401 Jacobs Creek Drive
Enrollment: 776 students
77.9% white, 2.3% Black or African American, 9.6% Asian, 4.9% Hispanic/Latino, 5.4% two or more races
Free and reduced-price lunch participation: 8.6% free, 2.3% reduced
Gifted students: 10.4%
Statewide test scores (percent who meet or exceed standards): 73 language arts; 76 math
Arnold
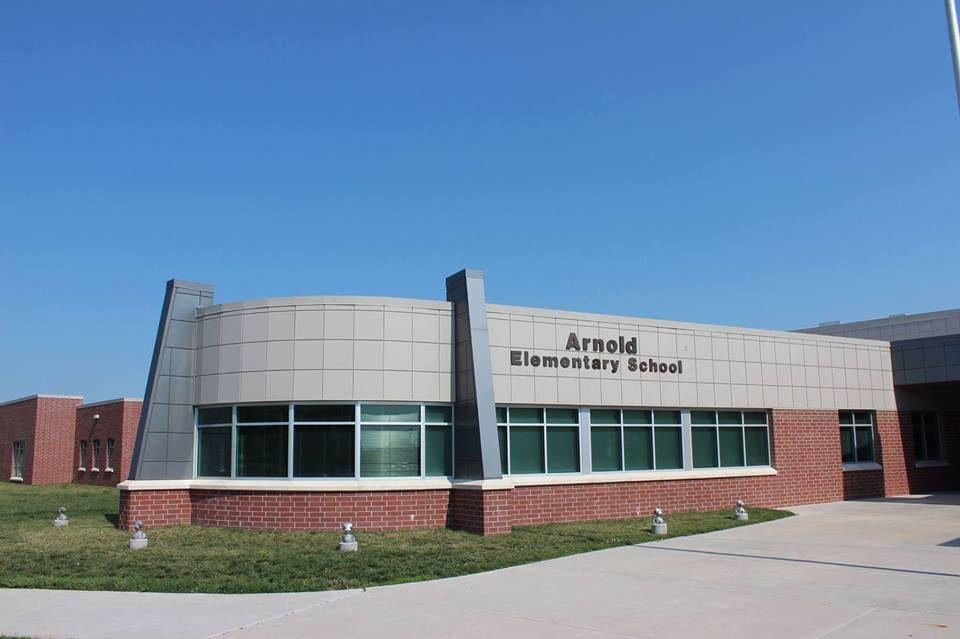
Arnold Elementary: 5000 Mike Scholl St.
Enrollment: 742 students
57.1% white, 1.5% American Indian or Alaska Native, 8.4% Black or African American, 1.5% Asian, 19.2% Hispanic/Latino, 0.3% Native Hawaiian or Pacific Islander, 12% two or more races
Free and reduced-price lunch participation: 46.7% free, 12.7% reduced
Gifted: 2.8%
Statewide test scores (percent who meet or exceed standards): 44 language arts, 32 math
Beattie

Beattie Elementary: 1901 Calvert St.
Enrollment: 368 students
73.6% white, 0.5% American Indian or Alaska Native, 3.3% Black or African American, 1.1% Asian, 8.2% Hispanic/Latino, 13.3% two or more races
Free or reduced-price lunch participation: 25.3% free, 8.2% reduced price
Gifted: 6.0%
Statewide test scores (percent who meet or exceed standards): 59 language arts, 55 math
Belmont

Belmont Elementary: 3425 N. 14th St.
Enrollment: 829 students
42.4% white, 0.9% American Indian or Alaska Native, 15.7% Black or African American, 2.2% Asian, 26.9% Hispanic/Latino, 11.8% two or more races
Free and reduced-price lunch participation: 67.5% free, 11.0% reduced
Gifted: 3.7%
Statewide test scores (percent who meet or exceed standards): 44 language arts, 34 math
Brownell
Brownell Elementary: 6000 Aylesworth Ave.
Enrollment: 320 students
65.9% white, 4.9% Black or African American, 0.3% Asian, 14.8% Hispanic/Latino, 14.1% two or more races
Free and reduced-price lunch participation: 45.2% free, 10.5% reduced
Gifted: 2.3%
Statewide test scores (percent who meet or exceed standards): 50 language arts, 37 math
Calvert
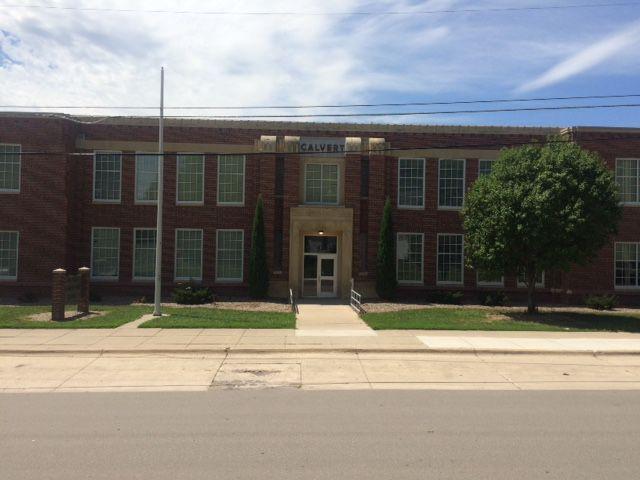
Calvert Elementary: 3709 S. 46th St.
Enrollment: 361 students
62.9% white, 1.2% American Indian or Alaska Native, 7.1% Black or African American, 1.5% Asian, 12.0% Hispanic/Latino, 15.3% two or more races
Free and reduced-price lunch participation: 45.7% free, 6.7% reduced
Gifted: 11.3%
Statewide test scores (percent who meet or exceed standards): 47 language arts, 31 math
Campbell

Campbell Elementary: 2200 Dodge St.
Enrollment: 591 students
46.6% white, 0.4% American Indian or Alaska Native, 14.3% Black or African American, 11.3% Asian, 16.6% Hispanic/Latino, 10.9% two or more races
Free and reduced-price lunch participation: 59.4% free, 10.5% reduced
Gifted: 4.2%
Statewide test scores (percent who meet or exceed standards): 38 language arts, 34 math
Cavett
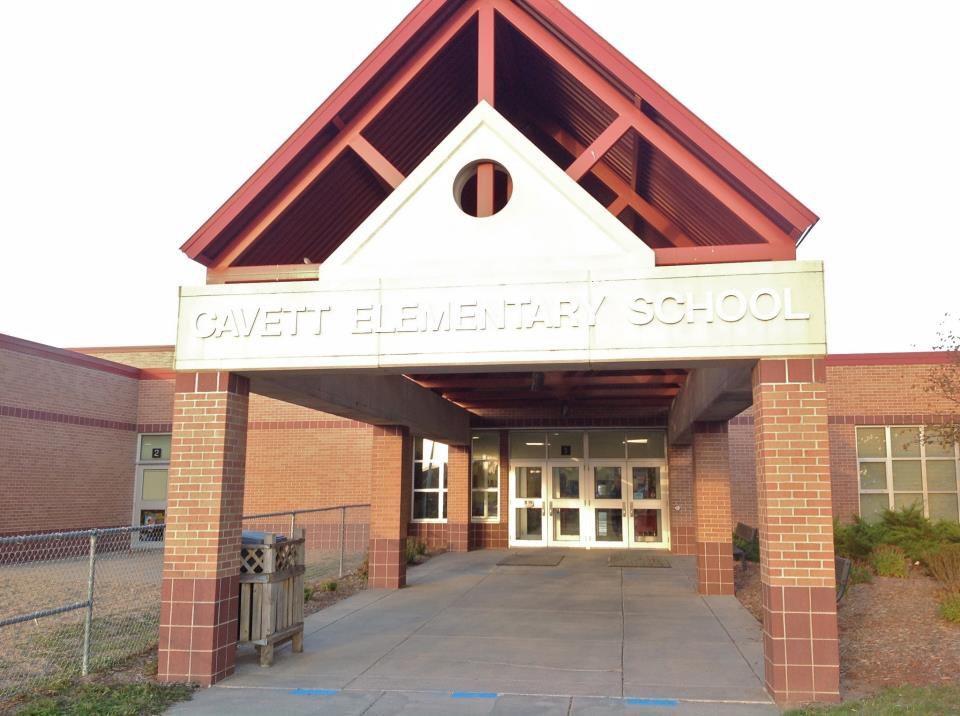
Cavett Elementary: 7701 S. 36th St.
Enrollment: 580 students
77.0% white, 0.5% American Indian or Alaska Native, 2.9% Black or African American, 4.0% Asian, 8.9% Hispanic, 6.6% two or more races
Free and reduced-price lunch participation: 10.4% free, 3.6% reduced
Gifted: 13.3%
Statewide test scores (percent who meet or exceed standards): 70 language arts, 69 math
Clinton
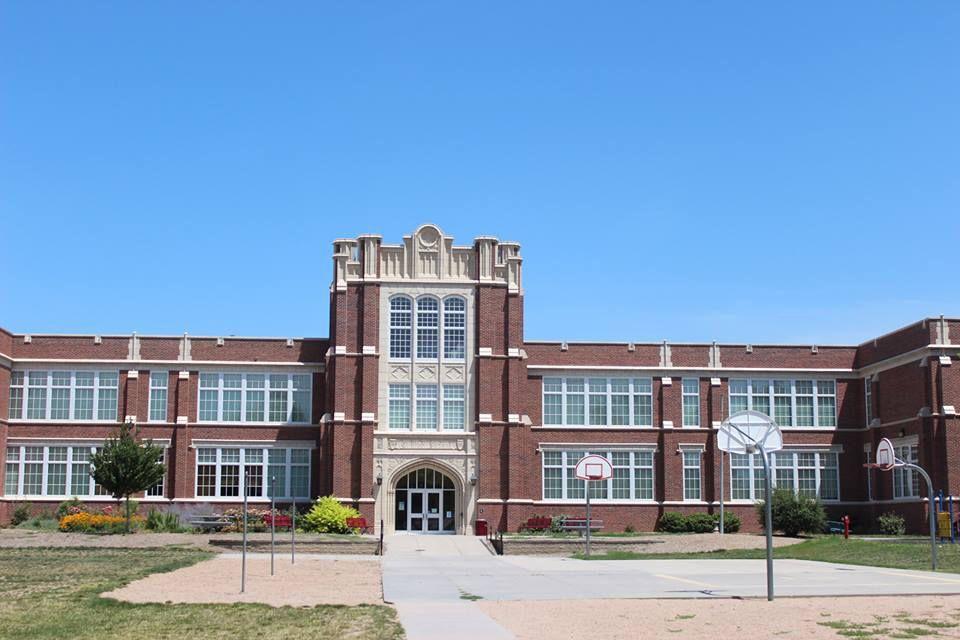
Clinton Elementary: 1520 N. 29th St.
Enrollment: 392 students
39.2% white, 0.3% American Indian or Alaska Native, 24.3% Black or African American, 4.7% Asian, 21.0% Hispanic/Latino, 10.5% two or more races
Free and reduced-price lunch participation: 81.2% free, 10.5% reduced
Gifted: 3.6%
Statewide test scores (percent who meet or exceed standards): 30 language arts, 30 math
Eastridge

Eastridge Elementary: 6245 L St.
Enrollment: 291 students
72.9% white, 1.0% American Indian or Alaska Native, 4.5% Black or African American, 1.4% Asian, 10.3% Hispanic/Latino, 10.0% two or more races
Free and reduced-price lunch participation: 25.8% free, 10.0% reduced
Gifted: 7.9%
Statewide test scores (percent who meet or exceed standards): 55 language arts, 51 math
Elliott
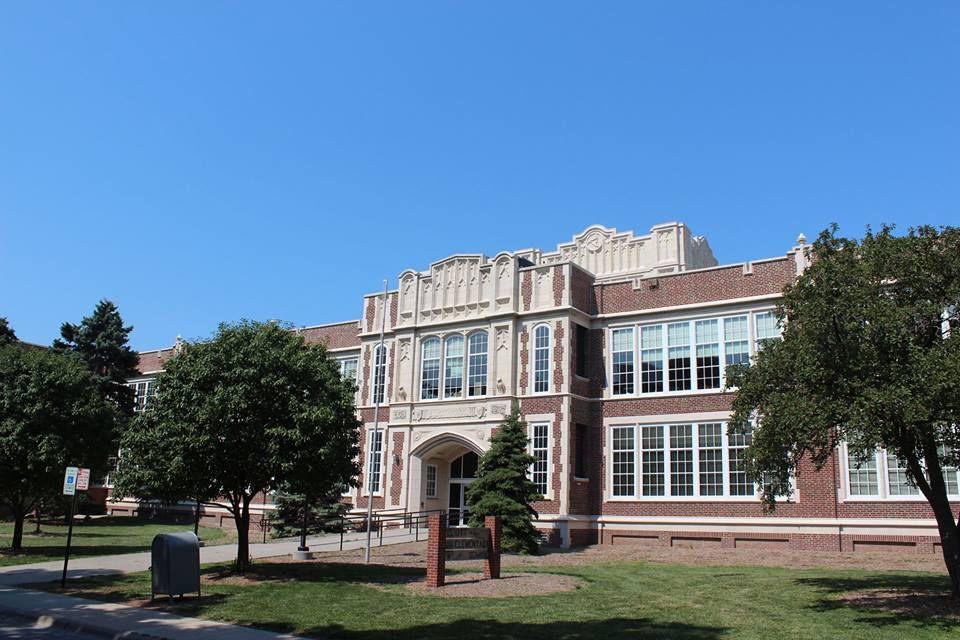
Elliott Elementary: 225 S. 25th St.
Enrollment: 383 students
23.3% white, 1.8% American Indian or Alaska Native, 13.7% Black or African American, 12.8% Asian, 33.7% Hispanic/Latino, 0.3% Native Hawaiian or Pacific Islander, 14.3% two or more races
Free and reduced-price lunch participation: 76.4% free, 6.3% reduced
Gifted: 4.5%
Statewide test scores (percentage who meet or exceed standards): 42 language arts, 35 math
Everett
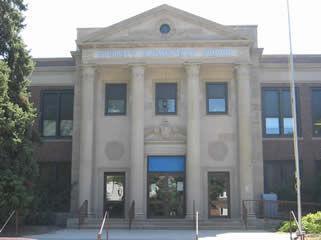
Everett Elementary: 1123 C St.
Enrollment: 374 students
27.8% white, 0.9% American Indian or Alaska Native, 13.5% Black or African American, 9.9% Asian, 40.4% Hispanic/Latino, 7.5% two or more races
Free and reduced-price lunch participation: 73.7% free, 8.7% reduced
Gifted: 5.4%
Statewide test scores (percentage who meet or exceed standards): 37 language arts, 24 math
Fredstrom

Fredstrom Elementary, 5700 N.W. 10th St.
Enrollment: 437 students
74.0% white, 0.5% American Indian or Alaska Native, 1.7% Black or African American, 3.6% Asian, 9.7% Hispanic, 10.4% two or more races
Free and reduced-price lunch participation: 22.3% free, 6.3% reduced
Gifted: 7.5%
Statewide test scores (percentage who meet or exceed standards): 52 language arts, 54 math
Hartley

Hartley Elementary, 730 N. 33rd St.
Enrollment: 339 students
37.5% white, 2.3% American Indian or Alaska Native, 17.5% Black or African American, 3.6% Asian, 25.9% Hispanic/Latino, 1.0% Native Hawaiian or Pacific Islander, 12.3% two or more races
Free and reduced-price lunch participation: 71.5% free, 9.4% reduced
Gifted: 3.2%
Statewide test scores (percentage who meet or exceed standards): 38 language arts, 28 math
Hill

Hill Elementary, 5230 Tipperary Trail
Enrollment: 449 students
72.2% white, 0.5% American Indian or Alaska Native, 4.8% Black or African American, 5.3% Asian, 10.3% Hispanic/Latino, 7.0% two or more races
Free and reduced-price lunch participation: 24.0% free, 5.0% reduced
Gifted: 10.3%
Statewide test scores (percentage who meet or exceed standards): 70 language arts, 59 math
Holmes

Holmes Elementary, 5230 Sumner St.
Enrollment: 393 students
70.7% white, 3.5% Black or African American, 3.5% Asian, 10.1% Hispanic/Latino, 0.3% Native Hawaiian or Pacific Islander, 11.9% two or more races
Free and reduced-price lunch participation: 37.1% free, 7.0% reduced
Gifted: 11.3%
Statewide test scores (percentage who meet or exceed standards): 61 language arts, 47 math
Humann
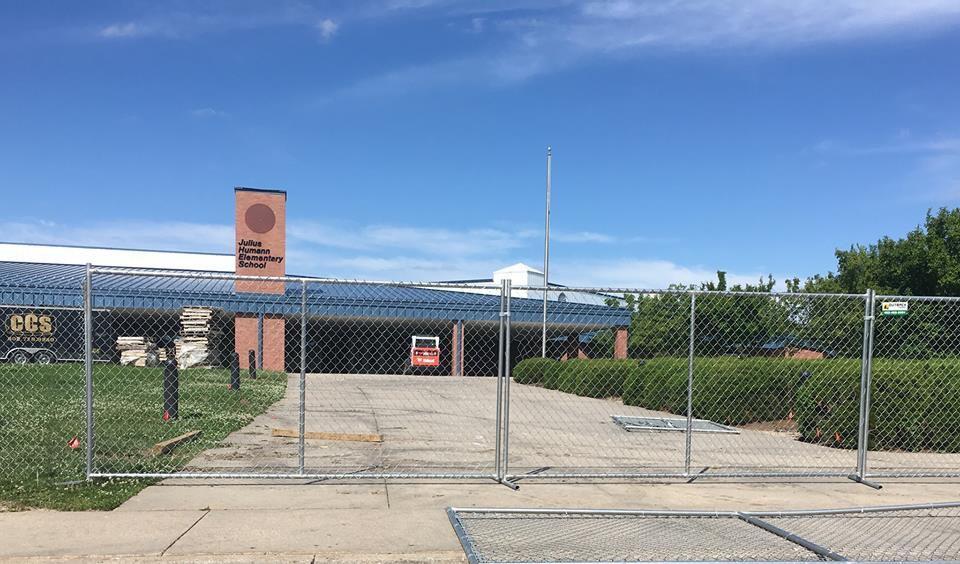
Humann Elementary, 6720 Rockwood Lane
Enrollment: 564 students
78.8% white, 0.6% American Indian or Alaska Native, 4.2% Black or African American, 1.3% Asian, 5.9% Hispanic/Latino, 9.3% two or more races
Free and reduced-price lunch participation: 23.9% free, 4.0% reduced
Gifted: 16.3%
Statewide test scores (percentage who meet or exceed standards): 72 language arts, 67 math
Huntington
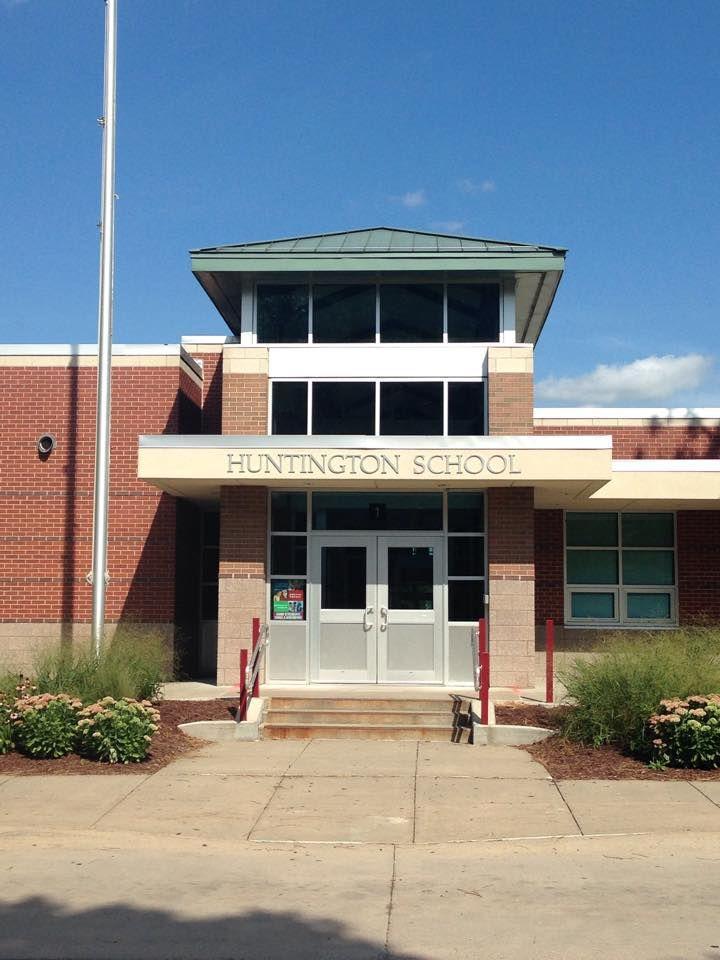
Huntington Elementary, 2900 N. 46th St.
Enrollment: 370 students
45.0% white, 0.6% American Indian or Alaska Native, 12.0% Black or African American, 1.5% Asian, 24.6% Hispanic/Latino, 16.2% two or more races
Free and reduced-price lunch participation: 67.0% free, 14.1% reduced
Gifted: 4.8%
Statewide test scores (percentage who meet or exceed standards): 32 language arts, 23 math
Kahoa

Kahoa Elementary, 7700 Leighton Ave.
Enrollment: 537 students
78.8% white, 0.4% American Indian or Alaska Native, 3.9% Black or African American, 2.6% Asian, 6.7% Hispanic/Latino, 7.6% two or more races
Free and reduced-price lunch participation: 22.9% free, 7.3% reduced
Gifted: 6.9%
Statewide test scores (percentage who meet or exceed standards): 66 language arts, 64 math
Kloefkorn
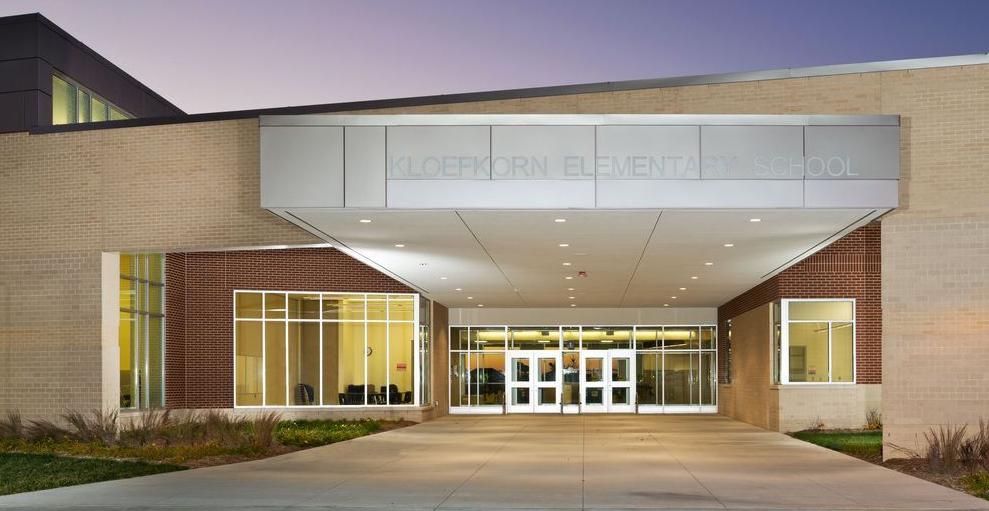
Kloefkorn Elementary, 6601 Glass Ridge Drive
Enrollment: 488 students
83.7% white, 0.7% American Indian or Alaska Native, 1.5% Black or African American, 4.4% Asian, 5.3% Hispanic/Latino, 4.4% two or more races
Free and reduced-price lunch participation: 6.2% free, 2.0% reduced
Gifted: 11.9%
Statewide test scores (percentage who meet or exceed standards): 77 language arts, 72 math
Kooser

Kooser Elementary, 7301 N. 13th St.
Enrollment: 821 students
63.5% white, 0.1% American Indian or Alaska Native, 5.6% Black or African American, 11.9% Asian, 11.1% Hispanic/Latino, 0.1% Native Hawaiian or Pacific Islander, 7.6% two or more races
Free and reduced-price lunch participation: 30.0% free, 8.3% reduced
Gifted: 2.9%
Statewide test scores (percentage who meet or exceed standards): 55 language arts, 49 math
Lakeview

Lakeview Elementary, 300 Capitol Beach Blvd.
Enrollment: 400 students
53.0% white, 0.8% American Indian or Alaska Native, 9.3% Black or African American, 3.8% Asian, 22.8% Hispanic/Latino, 10.5% two or more races
Free and reduced-price lunch participation: 57.0% free, 9.5% reduced
Gifted: 1.8%
Statewide test scores (percentage who meet or exceed standards): 35 language arts, 29 math
Maxey

Maxey Elementary, 5200 S. 75th St.
Enrollment: 683 students
75.9% white, 0.3% American Indian or Alaska Native, 1.2% Black or African American, 13.5% Asian, 3.4% Hispanic/Latino, 0.2% Native Hawaiian or Pacific Islander, 5.5% two or more races
Free and reduced-price lunch participation: 10.6% free, 3.4% reduced
Gifted: 10.4%
Statewide test scores (percentage who meet or exceed standards): 70 language arts, 69 math
McPhee

McPhee Elementary, 820 Goodhue Blvd.
Enrollment: 304 students
26.8% white, 1.4% American Indian or Alaska Native, 16.3% Black or African American, 12.7% Asian, 35.9% Hispanic/Latino and 6.9% two or more races
Free and reduced-price lunch participation: 77.2% free, 6.9% reduced
Gifted: 4.0%
Statewide test scores (percentage who meet or exceed standards): 36 language arts, 22 math
Meadow Lane

Meadow Lane Elementary, 7200 Vine St.
Enrollment: 620 students
72.1% white, 0.2% American Indian or Alaska Native, 2.8% Black or African American, 2.6% Asian, 13.8% Hispanic/Latino, 8.6% two or more races
Free and reduced-price lunch participation: 33.6% free, 8.1% reduced
Gifted: 8.3%
Statewide test scores (percentage who meet or exceed standards): 51 language arts, 39 math
Morley

Morley Elementary, 6800 Monterey Drive
Enrollment: 421 students
78.1% white, 0.2% American Indian or Alaska Native, 3.8% Black or African American, 0.2% Asian, 7.4% Hispanic, 0.5% Native Hawaiian or Pacific Islander, 9.7% two or more races
Free and reduced-price lunch participation: 20.2% free, 5.5% reduced
Gifted: 15.4%
Statewide test scores (percentage who meet or exceed standards): 69 language arts, 56 math
Norwood Park
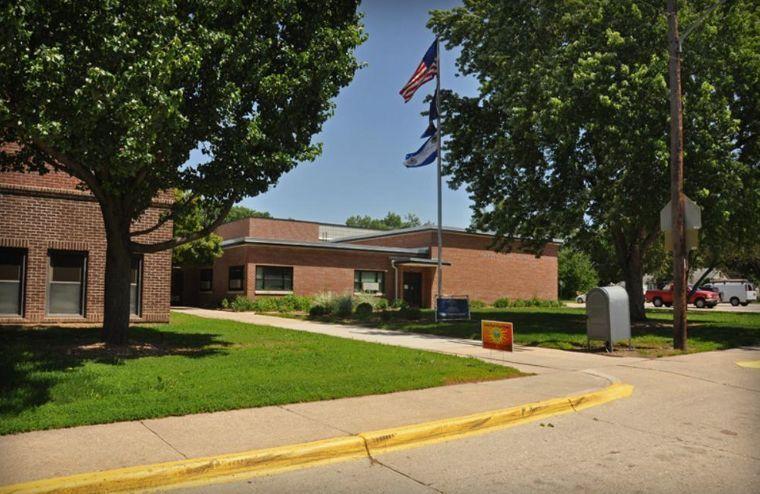
Norwood Park Elementary, 4710 N. 72nd St.
Enrollment: 238 students
68.0% white, 4.4% Black or African American, 2.4% Asian, 18.9% Hispanic/Latino, 6.3% two or more races
Free and reduced-price lunch participation: 46.6% free, 15.0% reduced
Gifted: 4.9%
Statewide test scores (percentage who meet or exceed standards): 43 language arts, 30 math
Pershing

Pershing Elementary, 6402 Judson St.
Enrollment: 430 students
57.5% white, 0.5% American Indian or Alaska Native, 6.6% Black or African American, 3.3% Asian, 20.6% Hispanic/Latino, 11.5% two or more races
Free and reduced-price lunch participation: 54.5% free, 12.7% reduced
Gifted: 4.3%
Statewide test scores (percentage who meet or exceed standards): 49 language arts, 50 math
Prescott

Prescott Elementary, 1930 S. 20th St.
Enrollment: 492 students
44.9% white, 0.9% American Indian or Alaska Native, 13.8% Black or African American, 7.3% Asian, 18.8% Hispanic/Latino, 0.5% Native Hawaiian or Pacific Islander, 13.8% two or more races
Free and reduced-price lunch participation: 51.2% free, 9.5% reduced
Gifted: 7.5%
Statewide test scores (percentage who meet or exceed standards): 52 language arts, 36 math
Pyrtle
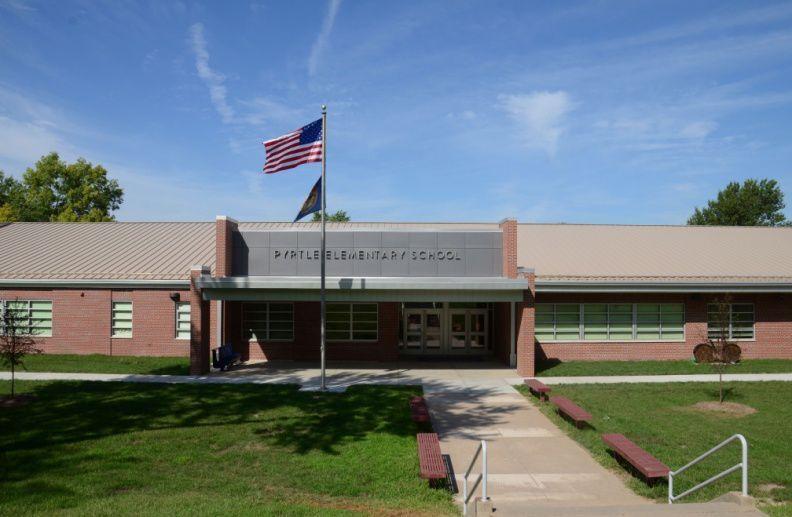
Pyrtle Elementary, 721 Cottonwood Drive
Enrollment: 454 students
78.9% white, 1.9% Black or African American, 2.6% Asian, 10.0% Hispanic/Latino, 6.7% two or more races
Free and reduced-price lunch participation: 17.3% free, 3.6% reduced
Gifted: 17.3%
Statewide test scores (percentage who meet or exceed standards): 68 language arts, 60 math
Randolph

Randolph Elementary, 1024 S. 37th St.
Enrollment: 428 students
61.4% white, 0.9% American Indian or Alaska Native, 5.6% Black or African American, 3.7% Asian, 16.4% Hispanic/Latino, 0.5% Native Hawaiian or Pacific Islander, 11.4% two or more races
Free and reduced-lunch participation: 45.6% free, 8.9% reduced
Gifted: 3.0%
Statewide test scores (percentage who meet or exceed standards): 53 language arts, 40 math
Riley

Riley Elementary, 5021 Orchard St.
Enrollment: 321 students
49.5% white, 0.6% American Indian or Alaska Native, 6.9% Black or African American, 3.4% Asian, 22.7% Hispanic/Latino, 16.8% two or more races
Free and reduced-price lunch participation: 55.1% free, 10.0% reduced
Gifted: 5.3%
Statewide test scores (percentage who meet or exceed standards): 44 language arts, 42 math
Roper

Roper Elementary, 2323 S. Coddington
Enrollment: 803 students
53.5% white, 0.4% American Indian or Alaska Native, 9.9% Black or African American, 6.9% Asian, 21.2% Hispanic/Latino, 8.1% two or more races
Free and reduced-price lunch participation: 40.0% free, 10.4% reduced
Gifted: 6.5%
Statewide test scores (percentage who meet or exceed standards): 44 language arts, 46 math
Rousseau

Rousseau Elementary, 3701 S 33rd St.
Enrollment: 531 students
72.9% white, 0.2% American Indian or Alaska Native, 4.0% Black or African American, 3.4% Asian, 7.0% Hispanic/Latino, 0.2% Native Hawaiian or Pacific Islander, 12.2% two or more races
Free and reduced-price lunch participation: 22.7% free, 8.4% reduced
Gifted: 14.7%
Statewide test scores (percentage who meet or exceed standards): 68 language arts, 63 math
Saratoga
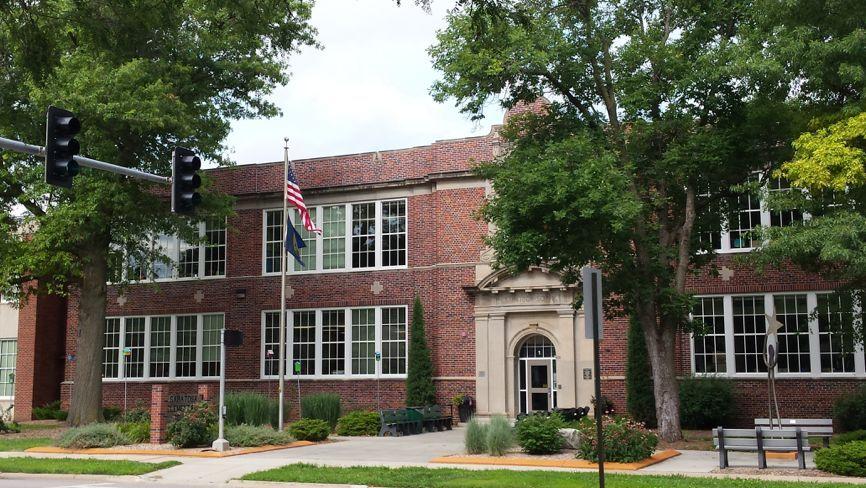
Saratoga Elementary, 2215 S. 13th St.
Enrollment: 235 students
48.5% white, 1.5% American Indian or Alaska Native, 7.8% Black or African American, 3.4% Asian, 26.2% Hispanic/Latino, 12.6% two or more races
Free and reduced-price lunch participation: 61.7% free, 9.7% reduced
Gifted: 5.8%
Statewide test scores (percentage who meet or exceed standards): 36 language arts, 25 math
Sheridan

Sheridan Elementary, 3100 Plymouth Ave.
Enrollment: 407 students
86.0% white, 0.2% American Indian or Alaska Native, 1.5% Black or African American, 0.5% Asian, 4.9% Hispanic/Latino, 6.9% two or more races
Free and reduced-price lunch participation: 12.0% free, 5.2% reduced
Gifted: 17.4%
Statewide test scores (percentage who meet or exceed standards): 74 language arts, 64 math
West Lincoln

West Lincoln Elementary, 630 W. Dawes Ave.
Enrollment: 505 students
37.0% white, 0.4% American Indian or Alaska Native, 9.7% Black or African American, 2.4% Asian, 41.2% Hispanic, 9.3% two or more races
Free and reduced-price lunch participation: 72.1% free, 10.3% reduced
Gifted: 3.8%
Statewide test scores (percentage who meet or exceed standards): 32 language arts, 29 math
Wysong
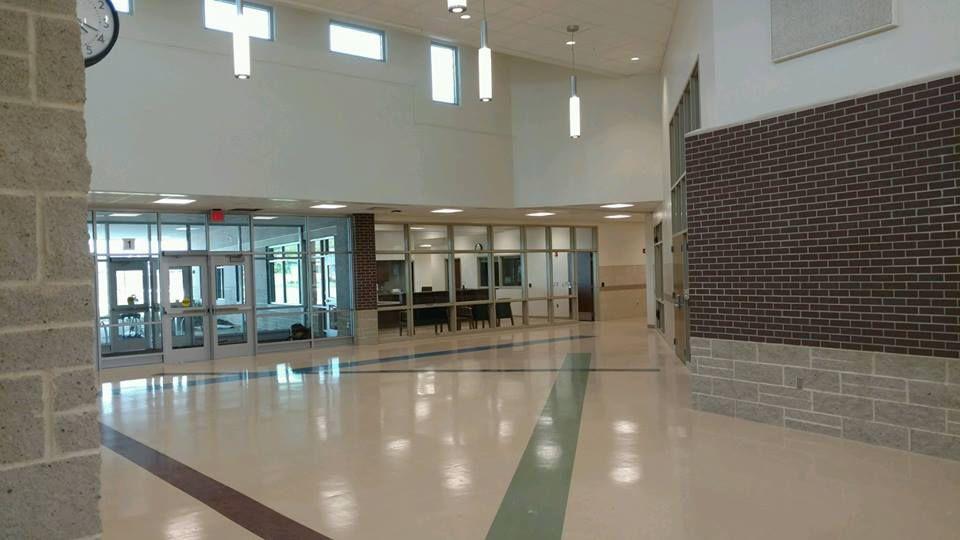
Wysong Elementary, 7901 Blanchard Blvd.
Enrollment: 684 students
89.9% white, 0.1% Black or African American, 2.2% Asian, 3.8% Hispanic/Latino, 3.9% two or more races
Free and reduced-price lunch participation: 3.9% free, 1.5% reduced
Gifted: 7.5%
Statewide test scores (percentage who meet or exceed standards): 75 language arts, 68 math
Zeman

Zeman Elementary, 4900 S. 52nd St.
Enrollment: 440 students
63.0% white, 0.9% American Indian or Alaska Native, 4.8% Black or African American, 3.0% Asian, 16.1% Hispanic/Latino, 12.3% two or more races
Free and reduced-price lunch participation: 29.5% free, 9.3% reduced
Gifted: 3.4%
Statewide test scores (percentage who meet or exceed standards): 58 language arts, 49 math
Culler

Culler Middle School, 5201 Vine St.
Enrollment: 708 students
39.4% white, 1.0% American Indian or Alaska Native, 14.7% Black or African American, 7.1% Asian, 27.3% Hispanic/Latino, 0.1% Native Hawaiian or Pacific Islander, 10.5% two or more races
Free and reduced-price lunch participation: 60.9% free, 9.3% reduced
Gifted: 8.3%
Statewide test scores (percentage who meet or exceed standards): 32 language arts, 30 math
Dawes
Dawes Middle School, 5130 Colfax Ave.
Enrollment: 398 students
55.0% white, 0.3% American Indian or Alaska Native, 8.3% Black or African American, 2.3% Asian, 19.8% Hispanic/Latino, 14.3% two or more races
Free and reduced-price lunch participation: 53.3% free, 13.1% reduced
Gifted: 10.6%
Statewide test scores (percentage who meet or exceed standards): 37 language arts, 32 math
Goodrich

Goodrich Middle School, 4600 Lewis Ave.
Enrollment: 818 students
42.9% white, 1.1% American Indian or Alaska Native, 13.0% Black or African American, 4.0% Asian, 29.5% Hispanic/Latino, 9.5% two or more races
Free and reduced-price lunch participation: 61.6% free, 11.1% reduced
Gifted: 9.7%
Statewide test scores (percentage who meet or exceed standards): 36 language arts, 38 math
Irving

Irving Middle School, 2745 S. 22nd St.
Enrollment: 910 students
62.7% white, 0.8% American Indian or Alaska Native, 6.5% Black or African American, 3.2% Asian, 14.3% Hispanic/Latino, 12.5% two or more races
Free and reduced-price lunch participation: 35.4% free, 8.1% reduced
Gifted: 26.6%
Statewide test scores (percentage who meet or exceed standards): 55 language arts, 49 math
Lefler
Lefler Middle School, 1100 S. 48th St.
Enrollment: 558 students
57.9% white, 0.7% American Indian or Alaska Native, 9.5% Black or African American, 4.7% Asian, 15.8% Hispanic/Latino, 0.2% Native Hawaiian or Pacific Islander, 11.3% two or more races
Free and reduced-price lunch participation: 43.7% free, 12.0% reduced
Gifted: 13.8%
Statewide test scores (percentage who meet or exceed standards): 45 language arts, 45 math
Lux
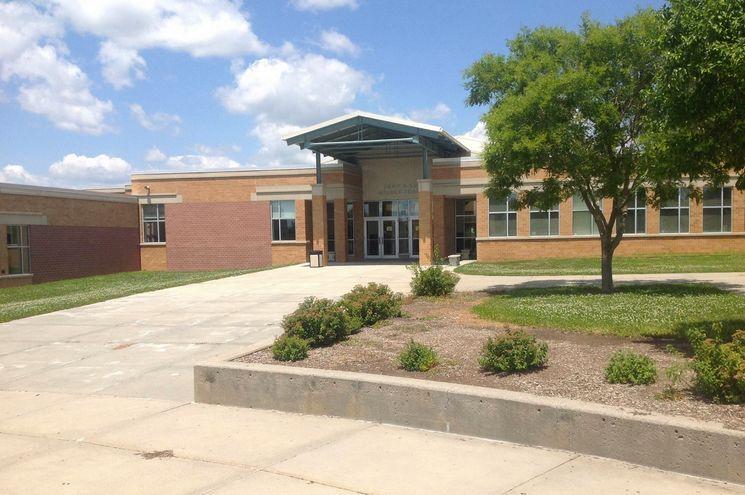
Lux Middle School, 7800 High St.
Enrollment: 789 students
80.0% white, 0.1% American Indian or Alaska Native, 2.7% Black or African American, 3.8% Asian, 7.2% Hispanic/Latino, 0.1% Native Hawaiian or Pacific Islander, 6.1% two or more races
Free and reduced-price lunch participation: 10.5% free, 6.3% reduced
Gifted: 28.3%
Statewide test scores (percentage who meet or exceed standards): 66 language arts, 68 math
Mickle
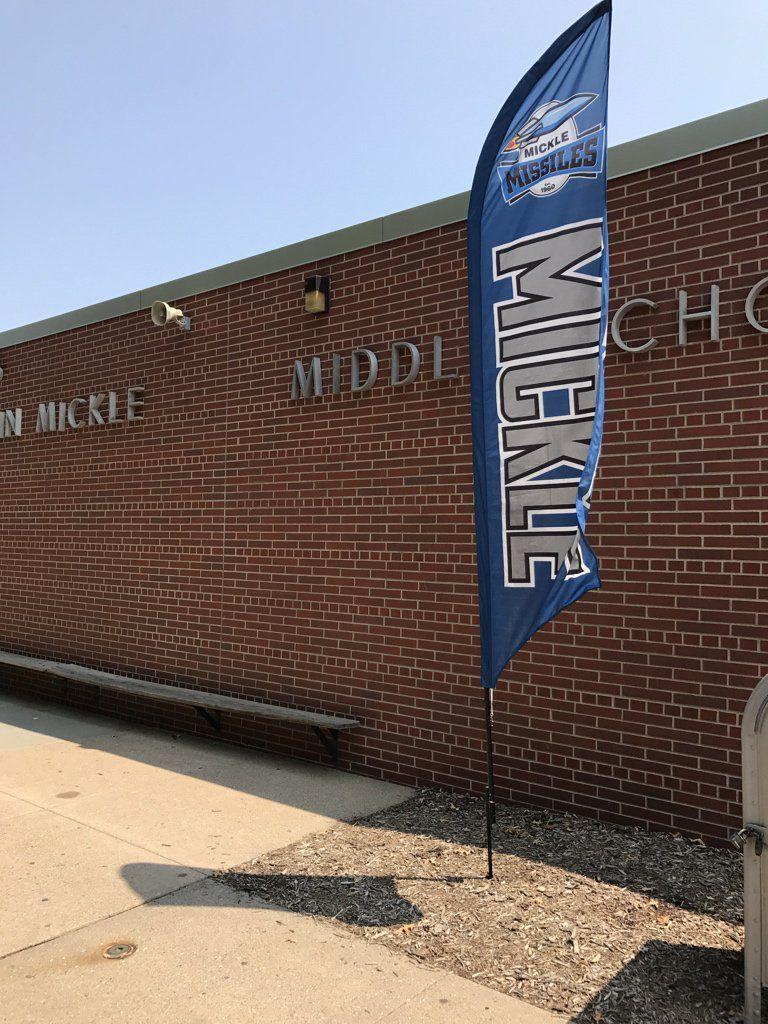
Mickle Middle School, 2500 N. 67th St.
Enrollment: 719 students
70.9% white, 0.1% American Indian or Alaska Native, 2.8% Black or African American, 1.5% Asian, 11.8% Hispanic/Latino, 12.8% two or more races
Free and reduced-price lunch participation: 34.9% free, 9.5% reduced
Gifted: 17.1%
Statewide test scores (percentage who meet or exceed standards): 55 language arts, 53 math
Moore

Moore Middle School, 8700 Yankee Woods Drive
Enrollment: 646 students
86.4% white, 0.6% American Indian or Alaska Native, 0.6% Black or African American, 4.3% Asian, 3.4% Hispanic/Latino, 4.6% two or more races
Free and reduced-price lunch participation: 7.0% free, 2.3% reduced
Gifted: 27.6%
Statewide test scores (percentage who meet or exceed standards): 69 language arts, 78 math
Park
Park Middle School, 855 S. Eighth St.
Enrollment: 833 students
41.2% white, 0.6% American Indian or Alaska Native, 11.9% Black or African American, 6.7% Asian, 30.1% Hispanic/Latino, 0.2% Native Hawaiian or Pacific Islander, 9.2% two or more races
Free and reduced-price lunch participation: 55.8% free, 10.4% reduced
Gifted: 9.8%
Statewide test scores (percentage who meet or exceed standards): 37 language arts, 37 math
Pound

Pound Middle School, 4740 S. 45th St.
Enrollment: 700 students
67.6% white, 0.6% American Indian or Alaska Native, 4.6% Black or African American, 2.4% Asian, 12.4% Hispanic/Latino, 0.1% Native Hawaiian or Pacific Islander, 12.3% two or more races
Free and reduced-price lunch participation: 25.7% free, 8.6% reduced
Gifted: 22.4%
Statewide test scores (percentage who meet or exceed standards): 59 language arts, 60 math
Schoo

Schoo Middle School, 700 Penrose Drive
Enrollment: 898 students
63.9% white, 0.4% American Indian or Alaska Native, 7.2% Black or African American, 5.0% Asian, 12.1% Hispanic/Latino, 0.1% Native Hawaiian or Pacific Islander, 11.1% two or more races
Free and reduced-price lunch participation: 30.3% free, 9.7% reduced
Gifted: 15.5%
Statewide test scores (percentage who meet or exceed standards): 50 language arts, 48 math
Scott

Scott Middle School, 2200 Pine Lake Road
Enrollment: 1,182 students
77.7% white, 0.2% American Indian or Alaska Native, 3.2% Black or African American, 4.6% Asian, 7.2% Hispanic/Latino, 7.1% two or more races
Free and reduced-price lunch participation: 13.1% free, 4.3% reduced
Gifted: 30.1%
Statewide test scores (percentage who meet or exceed standards): 65 language arts, 70 math
East
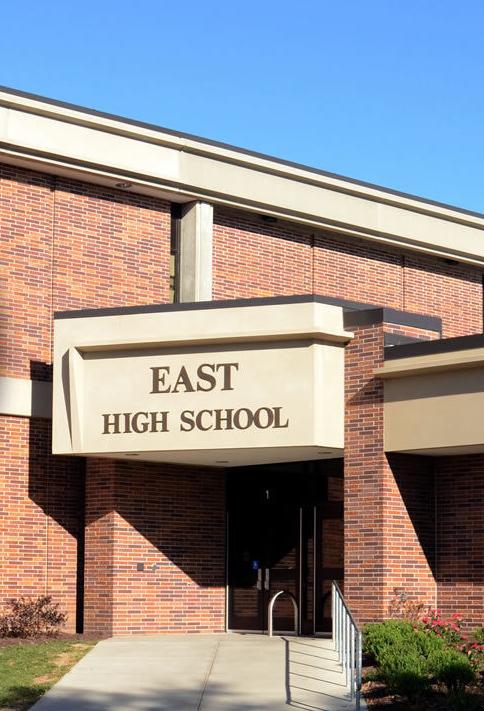
East High School, 1000 S. 70th St.
Enrollment: 2,250 students
78.7% white, 0.2% American Indian or Alaska Native, 2.2% Black or African American, 4.6% Asian, 8.4% Hispanic/Latino, 5.8% two or more races
Free and reduced-price lunch participation: 14.6% free, 5.3% reduced
Gifted: 24.4%
Statewide test scores (percentage who meet or exceed standards): 59 language arts, 58 math, 63 science
Lincoln High

Lincoln High School, 2229 J St.
Enrollment: 2,320 students
42.6% white, 1.7% American Indian or Alaska Native, 11.9% Black or African American, 8.9% Asian, 23.3% Hispanic/Latino, 0.1% Native Hawaiian or Pacific Islander, 11.5% two or more races
Free and reduced-price lunch participation: 47.5% free, 9.7% reduced
Gifted: 15.5%
Statewide test scores (percentage who meet or exceed standards): 36 language arts, 34 math, 34 science
North Star
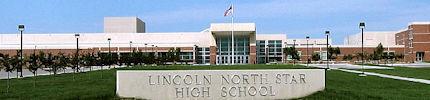
North Star High School, 5801 N. 33rd St.
Enrollment: 2,243 students
54.9% white, 0.4% American Indian or Alaska Native, 8.7% Black or African American, 6.5% Asian, 21.5% Hispanic/Latino, 7.9% two or more races
Free and reduced-price lunch participation: 42.1% free, 9.7% reduced
Gifted: 10.1%
Statewide test scores (percentage who meet or exceed standards): 29 language arts, 31 math, 34 science
Northeast
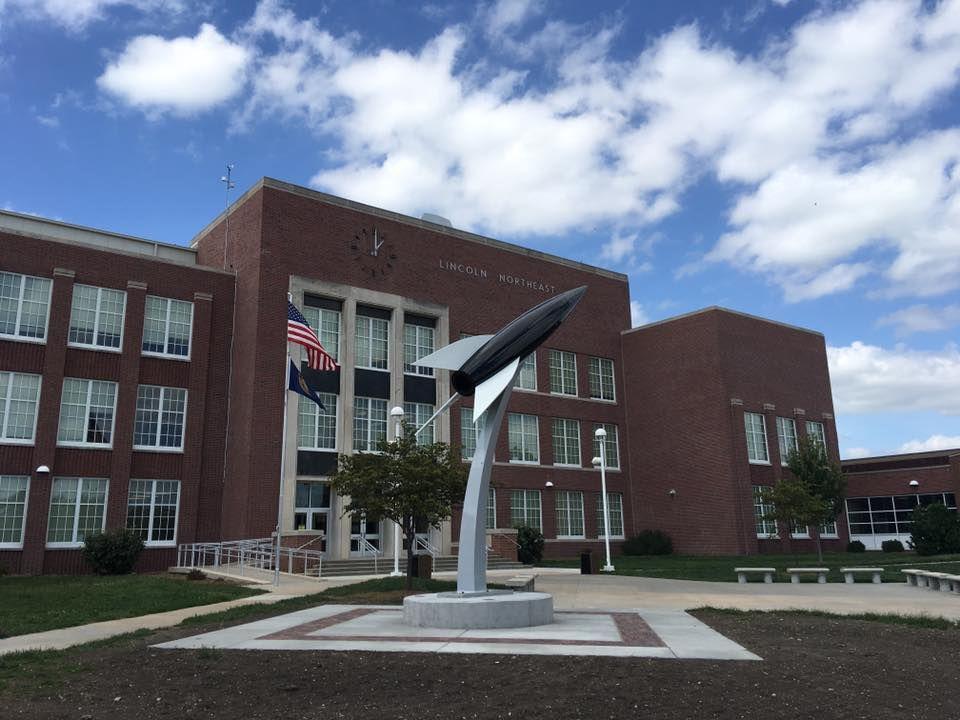
Northeast High School, 2635 N. 63rd St.
Enrollment: 1,869 students
59.4% white, 1.3% American Indian or Alaska Native, 9.7% Black or African American, 2.4% Asian, 17.1% Hispanic/Latino, 0.2% Native Hawaiian or Pacific Islander, 10.0% two or more races
Free and reduced-price lunch participation: 49.9% free, 10.8% reduced
Gifted: 10.6%
Statewide test scores (percentage who meet or exceed standards): 32 language arts, 30 math, 34 science
Southeast
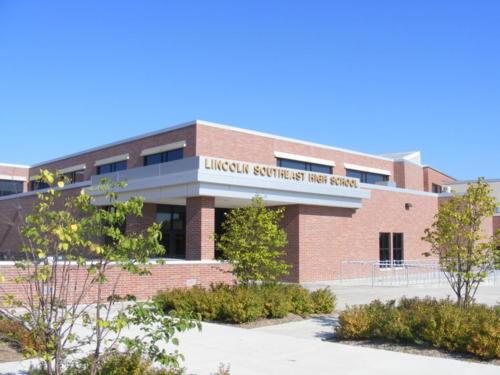
Southeast High School, 2930 S. 37th St.
Enrollment: 1,980 students
73.4% white, 1.1% American Indian or Alaska Native, 3.8% Black or African American, 1.2% Asian, 10.6% Hispanic/Latino, 0.3% Native Hawaiian or Pacific Islander, 9.6% two or more races
Free and reduced-price lunch participation: 25.1% free, 7.6% reduced
Gifted: 22.6%
Statewide test scores (percentage who meet or exceed standards): 49 language arts, 48 math, 53 science
Southwest
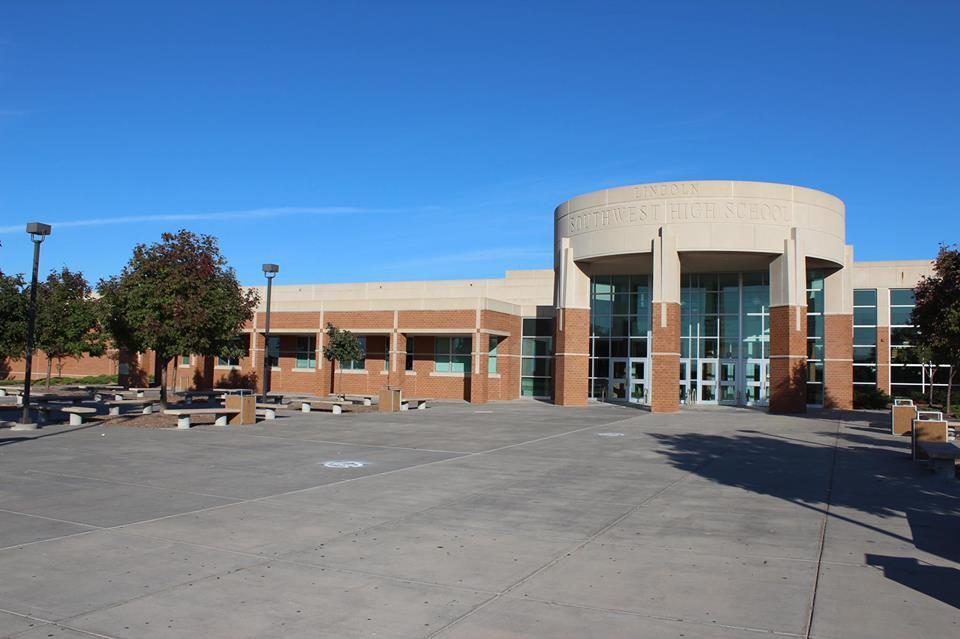
Southwest High School, 7001 S. 14th St.
Enrollment: 2,196 students
76.8% white, 0.2% American Indian or Alaska Native, 3.9% Black or African American, 3.8% Asian, 9.6% Hispanic/Latino, 5.7% two or more races
Free and reduced-price lunch participation: 17.7% free, 5.1% reduced
Gifted: 24.4%
Statewide test scores (percentage who meet or exceed standards): 62 language arts, 58 math, 64 science

