


Through more than five years of President Donald Trump’s non-consecutive presidency, we’ve witnessed some of the wildest volatility in Wall Street’s storied history. Based on single-session percentage moves, the Dow Jones Industrial Average (^DJI +0.28%), S&P 500 (^GSPC +0.42%), and Nasdaq Composite (^IXIC +0.29%) all vacillated wildly during the COVID-19 crash in February-March 2020 and for a brief period during the tariff tantrum of early April 2025.
But at the same time, outsize returns have gone hand-in-hand with Trump’s presidency. During his first term, the Dow, S&P 500, and Nasdaq Composite soared 57%, 70%, and 142%, respectively. Since the start of his second term on Jan. 20, 2025, the Dow Jones, S&P 500, and Nasdaq Composite have rallied an additional 22%, 26%, and 33%, respectively.
According to Donald Trump, the stock market isn’t done delivering outsize returns under his watch. But when examined in the context of historical precedent, the president may soon be eating crow.
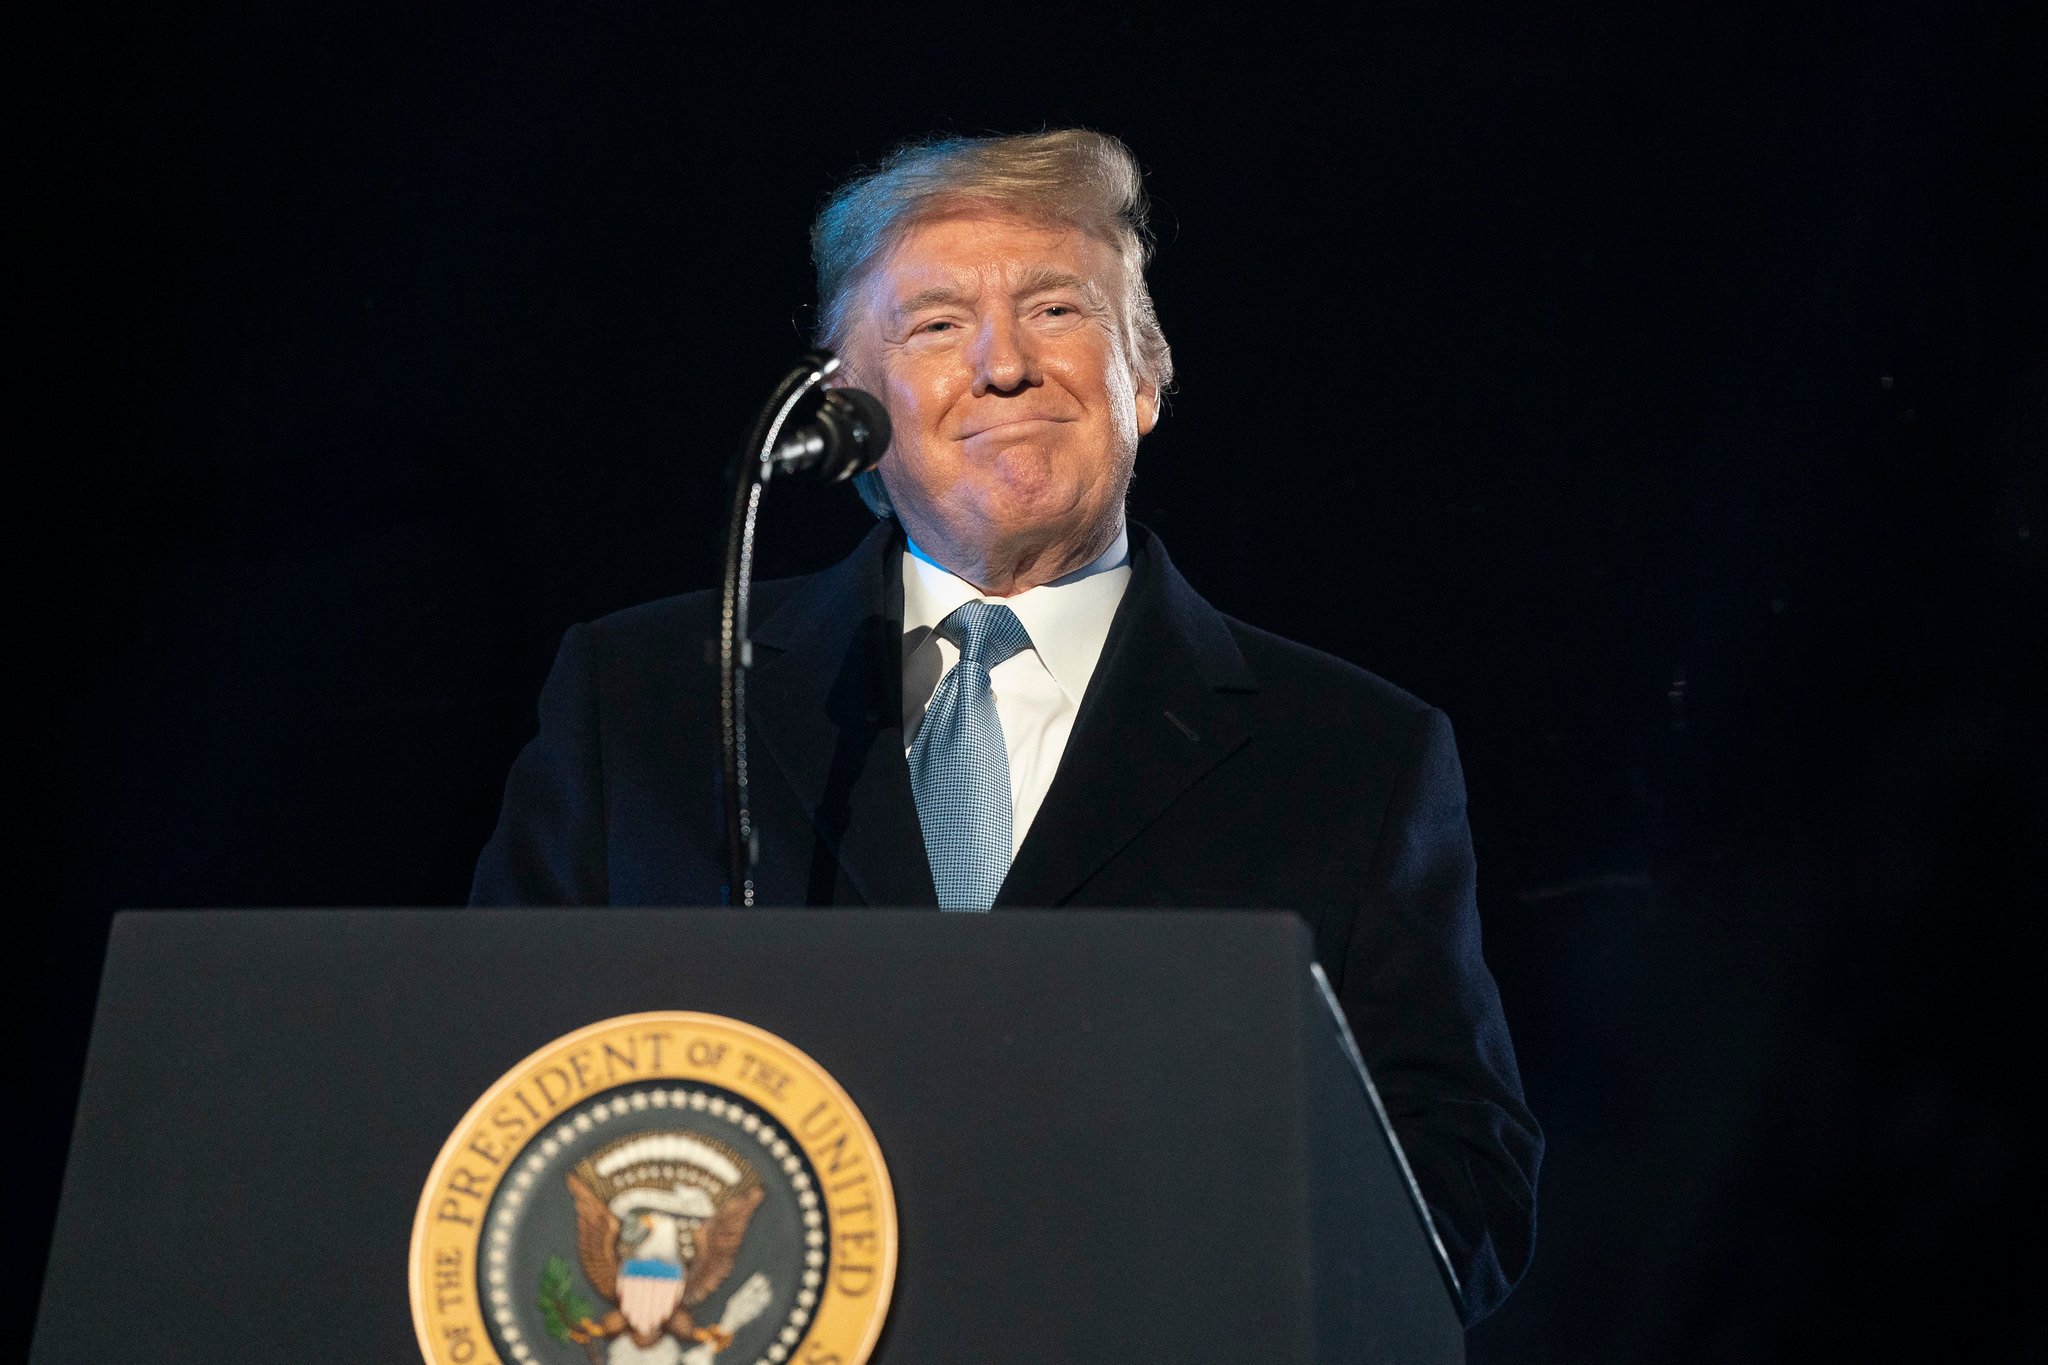
President Trump delivering remarks. Image source: Official White House Photo by Joyce N. Boghosian, courtesy of the National Archives.
The stock market has flourished under Donald Trump — and with good reason
On Monday, July 6, to celebrate the launch of tax-advantaged Trump Accounts that come with a potential $1,000 government contribution, the president ceremoniously rang the opening bell for the New York Stock Exchange and Nasdaq from the Oval Office.
After this ceremony, the president made clear that he believes the best is yet to come for Wall Street — especially with Trump Accounts viewed as a tailwind for equities. Said Donald Trump,
It’s going to go up — I think the [stock] market’s going to go through the roof.
Mind you, Trump made this comment with the Dow Jones Industrial Average reaching new highs and the S&P 500 and Nasdaq Composite a stone’s throw away from matching the Dow’s feat.
NOW: President Trump says today’s newborns could have a major financial head start by the time they turn 18 thanks to Trump Accounts.
While promoting today’s launch, he touted early investing as a way to create long-term wealth, while pointing to recent gains in the Dow, Nasdaq,… pic.twitter.com/L2u22leB1J
— Fox News (@FoxNews) July 6, 2026
Although the stock market has, indeed, soared under his tenure, not all upside catalysts have Trump’s fingerprints on them. For instance, the evolution of artificial intelligence (AI) was underway well before Donald Trump took office for his second term. The AI infrastructure build-out by Wall Street’s most influential businesses is easily the stock market’s top driver.
But there are aspects of Trump’s presidency that have been a boon for the stock market. For example, Trump’s flagship tax and spending law from his first term, the Tax Cuts and Jobs Act, permanently lowered the peak marginal corporate income tax rate from 35% to 21% (the lowest level since 1939). Businesses retaining more of their earnings led to record share buybacks by S&P 500 companies in 2025. Share repurchases can boost earnings per share and make a company more fundamentally attractive.
The president’s aforementioned Trump Accounts can also provide fresh capital for equities.
While history tells us that the president is absolutely right about the stock market going through the roof over multiple decades, he may be eating his words about the market going “through the roof” during his current term in short order.

Image source: Getty Images.
Historically insurmountable headwinds are piling up for Wall Street
To preface the following discussion, timing short-term directional market moves with any consistency is virtually impossible. Nevertheless, several correlated events throughout history suggest we’ve reached a tipping point for the Trump bull market.
For starters, stock valuations are virtually unjustifiable. Even with jaw-dropping growth expectations for AI-driven businesses, the S&P 500’s Shiller Price-to-Earnings (P/E) Ratio shows this to be the second-priciest stock market over the last 155 years. The Shiller P/E is also referred to as the Cyclically Adjusted P/E Ratio (CAPE Ratio).
When back-tested to January 1871, the Shiller P/E Ratio has averaged approximately 17.4. In early June, this iconic valuation tool reached 42.84. For context, the highest-ever CAPE Ratio was set in December 1999 (44.19), mere months before the dot-com bubble burst.
Shiller PE Ratio is now just 3.5% away from passing the Dot Com Bubble as the most expensive stock market valuation in history 🚨🚨🚨 pic.twitter.com/1ceOa3yhfs
— Barchart (@Barchart) June 1, 2026
The previous five instances during which the S&P 500’s Shiller P/E topped 30 were all eventually followed by declines in the Dow, S&P 500, and/or Nasdaq ranging from 20% to 89%. While the CAPE Ratio can’t pinpoint when the music will stop, it’s been able to identify imminent tipping points for expensive markets.
History also hasn’t been particularly kind to game-changing technologies. Every next-big-thing innovation for more than three decades has endured an early stage bubble that eventually burst. These bubbles burst because investors constantly overestimate the adoption and/or optimization aspect of game-changing innovations.
For example, the internet was widely adopted by businesses in the mid-to-late 1990s. However, it took over half a decade for companies to optimize this technology to boost sales and profits. It wasn’t until well after the dot-com bubble burst that the internet really improved the corporate growth trajectory.
Stock market bubbles throughout history…
AI stocks now ~40% of the market. pic.twitter.com/RxSAh09k6F
— Geiger Capital (@Geiger_Capital) May 8, 2026
More than likely, AI will suffer the same fate. While demand for AI infrastructure is otherworldly, businesses aren’t particularly close to optimizing this technology to lift sales and profits. Artificial intelligence has the hallmarks of previous bubbles that burst.
Margin debt is another glaring red flag that can have President Trump eating his words. “Margin” describes capital borrowed by investors from their broker. When used to purchase securities, margin can amplify gains if a security moves in the desired direction, as well as magnify losses if it moves the opposite way.
History shows that when outstanding margin debt climbs by 60% or more over a relatively short time frame (roughly a year), trouble awaits. Rapidly rising margin debt signals risk-taking — and risk-taking typically yields wild swings on Wall Street.
BREAKING: US margin debt jumped by +$112 billion in May, to a record $1.42 trillion.
This marks the 2nd consecutive monthly increase, totaling +$195 billion.
Margin debt has surged +$495 billion, or +54%, over the last 12 months.
Adjusted for inflation, this metric rose +7.9%… pic.twitter.com/DrambJNRpa
— The Kobeissi Letter (@KobeissiLetter) June 18, 2026
The previous times this century when we’ve witnessed margin debt soar by 66% to 95% over a 12- to 19-month period were all followed by major stock market declines (the dot-com bubble, the financial crisis, and the 2022 bear market). Outstanding margin debt has catapulted by 66% to a fresh record high of $1.416 trillion since April 2025 (through May 2026).
While there’s no question that the stock market climbs over multidecade periods, President Trump’s claim that “the [stock] market’s going to go through the roof” simply doesn’t align with anything that historical precedent tells us.

